Statistical graphics, also known as graphical techniques, are information graphics in the field of statistics used to visualize quantitative data.
Contents[hide]
|
[edit] Overview
Statistics and data analysis procedures can broadly be split into two parts: quantitative techniques and graphical techniques. Quantitative techniques are the set of statistical procedures that yield numeric or tabular output. Examples of quantitative techniques include hypothesis testing, analysis of variance, point estimation, confidence intervals, and least squares regression. These and similar techniques are all valuable and are mainstream in terms of classical analysis.[1]
On the other hand, there is a large collection of statistical tools that we generally refer to as graphical techniques. These include: scatter plots, histograms, probability plots, residual plots, box plots, block plots, and biplots. Exploratory data analysis (EDA) relies heavily on these and similar graphical techniques. Graphical procedures are not just tools used in an EDA context; such graphical tools are the shortest path to gaining insight into a data set in terms of testing assumptions, model selection and statistical model validation, estimator selection, relationship identification, factor effect determination, and outlier detection. In addition, good statistical graphics can provide a convincing means of communicating the underlying message that is present in the data to others.[1]
Graphical statistical methods have four objectives:[2]
- The exploration of the content of a data set
- The use to find structure in data
- Checking assumptions in statistical models
- Communicate the results of an analysis.
If one is not using statistical graphics, then one is forfeiting insight into one or more aspects of the underlying structure of the data.
[edit] History
Statistical graphics have been central to the development of science and date to the earliest attempts to analyse data. Many familiar forms, including bivariate plots, statistical maps, bar charts, and coordinate paper were used in the 18th century. Statistical graphics developed through attention to four problems:[3]
- Spatial organization in the 17th and 18th century
- Discrete comparison in the 18th and early 19th century
- Continuous distribution in the 19th century and
- Multivariate distribution and correlation in the late 19th and 20th century.
Since the 1970th statistical graphics have been re-emerging as an important analytic tool with the revitalisation of computer graphics and related technologies.[3]
[edit] Examples
Famous graphics were designed by:
- William Playfair who published what could be called the first pie chart and the well known diagram that depicts the evolution of England's imports and exports.
- Florence Nightingale, who used statistical graphics to persuade the British Government to improve army hygiene,
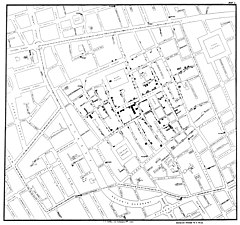
- John Snow who plotted deaths from cholera in London in 1854 to detect the source of the disease, and
- Charles Joseph Minard who designed a large portfolio of maps of which the one depicting Napoleon's campaign in Russia is the best known.
A special type of statistical graphic are the so called isotypes. These are graphical tools designed by Otto Neurath with the specific purpose of achieving changes in society through visual education of the masses.
[edit] See also
- List of graphical methods
- Visual inspection
[edit] References
- ^ a b Text from a public domain publication of the National Institute of Standards and Technology, a U.S. government agency.
- ^ William G. Jacoby (1997). Statistical Graphics for Univariate and Bivariate Data: Statistical Graphics pp.2–4
- ^ a b James R. Beniger and Dorothy L. Robyn (1978). "Quantitative graphics in statistics: A brief history". In: The American Statistician. 32: pp. 1–11.
[edit] Further reading
- W.S. Cleveland (1993). Visualizing Data. Summit, NJ, USA: Hobart Press. ISBN 0-9634884-0-6.
- W.S. Cleveland (1994). The Elements of Graphing Data. Summit, NJ, USA: Hobart Press. ISBN 0-9634884-1-4.
- Paul J. Lewi (2006). Speaking of Graphics. http://www.datascope.be/sog.htm.
- Edward R.Tufte (2001) [1983]. The Visual Display of Quantitative Information (2nd Edition ed.). Cheshire, CT, USA: Graphics Press. ISBN 0-9613921-4-2.
- Edward R. Tufte (1992) [1990]. Envisioning Information. Cheshire, CT, USA: Graphics Press. ISBN 0-961-39211-8.

No comments:
Post a Comment