- This article is about graphics created using computers. For the article about the scientific study of computer graphics, see Computer graphics (computer science). For other uses, see Computer graphics (disambiguation).
Computer graphics are graphics created using computers and, more generally, the representation and manipulation of image data by a computer.
The development of computer graphics, or simply referred to as CG, has made computers easier to interact with, and better for understanding and interpreting many types of data. Developments in computer graphics have had a profound impact on many types of media and have revolutionized the animation and video game industry.
Contents[hide]
|
[edit] Overview
The term computer graphics has been used in a broad sense to describe "almost everything on computers that is not text or sound"[1]. Typically, the term computer graphics refers to several different things:
- the representation and manipulation of image data by a computer
- the various technologies used to create and manipulate images
- the images so produced, and
- the sub-field of computer science which studies methods for digitally synthesizing and manipulating visual content, see study of computer graphics
Today, computers and computer-generated images touch many aspects of our daily life. Computer imagery is found on television, in newspapers, for example in their weather reports, or for example in all kinds of medical investigation and surgical procedures. A well-constructed graph can present complex statistics in a form that is easier to understand and interpret. In the media "such graphs are used to illustrate papers, reports, theses", and other presentation material.[2]
Many powerful tools have been developed to visualize data. Computer generated imagery can be categorized into several different types: 2D, 3D, and animated graphics. As technology has improved, 3D computer graphics have become more common, but 2D computer graphics are still widely used. Computer graphics has emerged as a sub-field of computer science which studies methods for digitally synthesizing and manipulating visual content. Over the past decade, other specialized fields have been developed like information visualization, and scientific visualization more concerned with "the visualization of three dimensional phenomena (architectural, meteorological, medical, biological, etc.), where the emphasis is on realistic renderings of volumes, surfaces, illumination sources, and so forth, perhaps with a dynamic (time) component".[3]
[edit] History
The advance in computer graphics was to come from one MIT student, Ivan Sutherland. In 1961 Sutherland created another computer drawing program called Sketchpad. Using a light pen, Sketchpad allowed one to draw simple shapes on the computer screen, save them and even recall them later. The light pen itself had a small photoelectric cell in its tip. This cell emitted an electronic pulse whenever it was placed in front of a computer screen and the screen's electron gun fired directly at it. By simply timing the electronic pulse with the current location of the electron gun, it was easy to pinpoint exactly where the pen was on the screen at any given moment. Once that was determined, the computer could then draw a cursor at that location.
Sutherland seemed to find the perfect solution for many of the graphics problems he faced. Even today, many standards of computer graphics interfaces got their start with this early Sketchpad program. One example of this is in drawing constraints. If one wants to draw a square for example, s/he doesn't have to worry about drawing four lines perfectly to form the edges of the box. One can simply specify that s/he wants to draw a box, and then specify the location and size of the box. The software will then construct a perfect box, with the right dimensions and at the right location. Another example is that Sutherland's software modeled objects - not just a picture of objects. In other words, with a model of a car, one could change the size of the tires without affecting the rest of the car. It could stretch the body of the car without deforming the tires.
These early computer graphics were Vector graphics, composed of thin lines whereas modern day graphics are Raster based using pixels. The difference between vector graphics and raster graphics can be illustrated with a shipwrecked sailor. He creates an SOS sign in the sand by arranging rocks in the shape of the letters "SOS." He also has some brightly colored rope, with which he makes a second "SOS" sign by arranging the rope in the shapes of the letters. The rock SOS sign is similar to raster graphics. Every pixel has to be individually accounted for. The rope SOS sign is equivalent to vector graphics. The computer simply sets the starting point and ending point for the line and perhaps bend it a little between the two end points. The disadvantages to vector files are that they cannot represent continuous tone images and they are limited in the number of colors available. Raster formats on the other hand work well for continuous tone images and can reproduce as many colors as needed.
Also in 1961 another student at MIT, Steve Russell, created the first video game, Spacewar. Written for the DEC PDP-1, Spacewar was an instant success and copies started flowing to other PDP-1 owners and eventually even DEC got a copy. The engineers at DEC used it as a diagnostic program on every new PDP-1 before shipping it. The sales force picked up on this quickly enough and when installing new units, would run the world's first video game for their new customers.
E. E. Zajac, a scientist at Bell Telephone Laboratory (BTL), created a film called "Simulation of a two-giro gravity attitude control system" in 1963. In this computer generated film, Zajac showed how the attitude of a satellite could be altered as it orbits the Earth. He created the animation on an IBM 7090 mainframe computer. Also at BTL, Ken Knowlton, Frank Sindon and Michael Noll started working in the computer graphics field. Sindon created a film called Force, Mass and Motion illustrating Newton's laws of motion in operation. Around the same time, other scientists were creating computer graphics to illustrate their research. At Lawrence Radiation Laboratory, Nelson Max created the films, "Flow of a Viscous Fluid" and "Propagation of Shock Waves in a Solid Form." Boeing Aircraft created a film called "Vibration of an Aircraft."
It wasn't long before major corporations started taking an interest in computer graphics. TRW, Lockheed-Georgia, General Electric and Sperry Rand are among the many companies that were getting started in computer graphics by the mid 1960's. IBM was quick to respond to this interest by releasing the IBM 2250 graphics terminal, the first commercially available graphics computer.
Ralph Baer, a supervising engineer at Sanders Associates, came up with a home video game in 1966 that was later licensed to Magnavox and called the Odyssey. While very simplistic, and requiring fairly inexpensive electronic parts, it allowed the player to move points of light around on a screen. It was the first consumer computer graphics product.
Also in 1966, Sutherland at MIT invented the first computer controlled head-mounted display (HMD). Called the Sword of Damocles because of the hardware required for support, it displayed two separate wireframe images, one for each eye. This allowed the viewer to see the computer scene in stereoscopic 3D. After receiving his Ph.D. from MIT, Sutherland became Director of Information Processing at ARPA (Advanced Research Projects Agency), and later became a professor at Harvard.
Dave Evans was director of engineering at Bendix Corporation's computer division from 1953 to 1962. After which he worked for the next five years as a visiting professor at Berkeley. There he continued his interest in computers and how they interfaced with people. In 1968 the University of Utah recruited Evans to form a computer science program, and computer graphics quickly became his primary interest. This new department would become the world's primary research center for computer graphics.
In 1967 Sutherland was recruited by Evans to join the computer science program at the University of Utah. There he perfected his HMD. Twenty years later, NASA would re-discover his techniques in their virtual reality research. At Utah, Sutherland and Evans were highly sought after consultants by large companies but they were frustrated at the lack of graphics hardware available at the time so they started formulating a plan to start their own company.
A student by the name of Ed Catmull got started at the University of Utah in 1970 and signed up for Sutherland's computer graphics class. Catmull had just come from The Boeing Company and had been working on his degree in physics. Growing up on Disney, Catmull loved animation yet quickly discovered that he didn't have the talent for drawing. Now Catmull (along with many others) saw computers as the natural progression of animation and they wanted to be part of the revolution. The first animation that Catmull saw was his own. He created an animation of his hand opening and closing. It became one of his goals to produce a feature length motion picture using computer graphics. In the same class, Fred Parkes created an animation of his wife's face. Because of Evan's and Sutherland's presence, UU was gaining quite a reputation as the place to be for computer graphics research so Catmull went there to learn 3D animation.
As the UU computer graphics laboratory was attracting people from all over, John Warnock was one of those early pioneers; he would later found Adobe Systems and create a revolution in the publishing world with his PostScript page description language. Tom Stockham led the image processing group at UU which worked closely with the computer graphics lab. Jim Clark was also there; he would later found Silicon Graphics, Inc.
The first major advance in 3D computer graphics was created at UU by these early pioneers, the hidden-surface algorithm. In order to draw a representation of a 3D object on the screen, the computer must determine which surfaces are "behind" the object from the viewer's perspective, and thus should be "hidden" when the computer creates (or renders) the image.
[edit] Image types
[edit] 2D computer graphics

2D computer graphics are the computer-based generation of digital images—mostly from two-dimensional models, such as 2D geometric models, text, and digital images, and by techniques specific to them. The word may stand for the branch of computer science that comprises such techniques, or for the models themselves.
2D computer graphics are mainly used in applications that were originally developed upon traditional printing and drawing technologies, such as typography, cartography, technical drawing, advertising, etc.. In those applications, the two-dimensional image is not just a representation of a real-world object, but an independent artifact with added semantic value; two-dimensional models are therefore preferred, because they give more direct control of the image than 3D computer graphics, whose approach is more akin to photography than to typography.
[edit] Pixel art
Pixel art is a form of digital art, created through the use of raster graphics software, where images are edited on the pixel level. Graphics in most old (or relatively limited) computer and video games, graphing calculator games, and many mobile phone games are mostly pixel art.
[edit] Vector graphics

Vector graphics formats are complementary to raster graphics, which is the representation of images as an array of pixels, as it is typically used for the representation of photographic images.[4] There are instances when working with vector tools and formats is best practice, and instances when working with raster tools and formats is best practice. There are times when both formats come together. An understanding of the advantages and limitations of each technology and the relationship between them is most likely to result in efficient and effective use of tools.
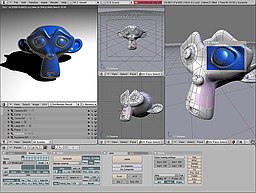
[edit] 3D computer graphics
3D computer graphics in contrast to 2D computer graphics are graphics that use a three-dimensional representation of geometric data that is stored in the computer for the purposes of performing calculations and rendering 2D images. Such images may be for later display or for real-time viewing.
Despite these differences, 3D computer graphics rely on many of the same algorithms as 2D computer vector graphics in the wire frame model and 2D computer raster graphics in the final rendered display. In computer graphics software, the distinction between 2D and 3D is occasionally blurred; 2D applications may use 3D techniques to achieve effects such as lighting, and primarily 3D may use 2D rendering techniques.
3D computer graphics are often referred to as 3D models. Apart from the rendered graphic, the model is contained within the graphical data file. However, there are differences. A 3D model is the mathematical representation of any three-dimensional object. A model is not technically a graphic until it is visually displayed. Due to 3D printing, 3D models are not confined to virtual space. A model can be displayed visually as a two-dimensional image through a process called 3D rendering, or used in non-graphical computer simulations and calculations.
[edit] Computer animation
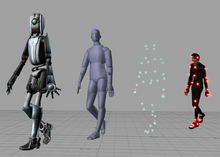
Computer animation is the art of creating moving images via the use of computers. It is a subfield of computer graphics and animation. Increasingly it is created by means of 3D computer graphics, though 2D computer graphics are still widely used for stylistic, low bandwidth, and faster real-time rendering needs. Sometimes the target of the animation is the computer itself, but sometimes the target is another medium, such as film. It is also referred to as CGI (Computer-generated imagery or computer-generated imaging), especially when used in films.
Virtual entities may contain and be controlled by assorted attributes, such as transform values (location, orientation, scale; see Cartesian coordinate system) stored in an object's transformation matrix. Animation is the change of an attribute over time. Multiple methods of achieving animation exist; the rudimentary form is based on the creation and editing of keyframes, each storing a value at a given time, per attribute to be animated. The 2D/3D graphics software will interpolate between keyframes, creating an editable curve of a value mapped over time, resulting in animation. Other methods of animation include procedural and expression-based techniques: the former consolidates related elements of animated entities into sets of attributes, useful for creating particle effects and crowd simulations; the latter allows an evaluated result returned from a user-defined logical expression, coupled with mathematics, to automate animation in a predictable way (convenient for controlling bone behavior beyond what a hierarchy offers in skeletal system set up).
To create the illusion of movement, an image is displayed on the computer screen then quickly replaced by a new image that is similar to the previous image, but shifted slightly. This technique is identical to the illusion of movement in television and motion pictures.
[edit] Concepts and Principles
[edit] Image
An image or picture is an artifact that resembles a physical object or person. The term includes two-dimensional objects like photographs and sometimes includes three-dimensional representations. Images are captured by optical devices—such as cameras, mirrors, lenses, telescopes, microscopes, etc. and natural objects and phenomena, such as the human eye or water surfaces.
A digital image is a representation of a two-dimensional image in binary format as a sequence of ones and zeros. Digital images include both vector images and raster images, but raster images are more commonly used.
[edit] Pixel
In digital imaging, a pixel (or picture element[5]) is a single point in a raster image. Pixels are normally arranged in a regular 2-dimensional grid, and are often represented using dots or squares. Each pixel is a sample of an original image, where more samples typically provide a more accurate representation of the original. The intensity of each pixel is variable; in color systems, each pixel has typically three
components such as red, green, and blue.
[edit] Graphics
Graphics are visual presentations on some surface, such as a wall, canvas, computer screen, paper, or stone to brand, inform, illustrate, or entertain. Examples are photographs, drawings, line art, graphs, diagrams, typography, numbers, symbols, geometric designs, maps, engineering drawings, or other images. Graphics often combine text, illustration, and color. Graphic design may consist of the deliberate selection, creation, or arrangement of typography alone, as in a brochure, flier, poster, web site, or book without any other element. Clarity or effective communication may be the objective, association with other cultural elements may be sought, or merely, the creation of a distinctive style.

[edit] Rendering
Rendering is the process of generating an image from a model, by means of computer programs. The model is a description of three dimensional objects in a strictly defined language or data structure. It would contain geometry, viewpoint, texture, lighting, and shading information. The image is a digital image or raster graphics image. The term may be by analogy with an "artist's rendering" of a scene. 'Rendering' is also used to describe the process of calculating effects in a video editing file to produce final video output.
- 3D projection
- 3D projection is a method of mapping three dimensional points to a two dimensional plane. As most current methods for displaying graphical data are based on planar two dimensional media, the use of this type of projection is widespread, especially in computer graphics, engineering and drafting.
- Ray tracing
- Ray tracing is a technique for generating an image by tracing the path of light through pixels in an image plane. The technique is capable of producing a very high degree of photorealism; usually higher than that of typical scanline rendering methods, but at a greater computational cost.
- Shading
- Shading refers to depicting depth in 3D models or illustrations by varying levels of darkness. It is a process used in drawing for depicting levels of darkness on paper by applying media more densely or with a darker shade for darker areas, and less densely or with a lighter shade for lighter areas. There are various techniques of shading including cross hatching where perpendicular lines of varying closeness are drawn in a grid pattern to shade an area. The closer the lines are together, the darker the area appears. Likewise, the farther apart the lines are, the lighter the area appears. The term has been recently generalized to mean that shaders are applied.
- Texture mapping
- Texture mapping is a method for adding detail, surface texture, or colour to a computer-generated graphic or 3D model. Its application to 3D graphics was pioneered by Dr Edwin Catmull in 1974. A texture map is applied (mapped) to the surface of a shape, or polygon. This process is akin to applying patterned paper to a plain white box. Multitexturing is the use of more than one texture at a time on a polygon.[6] Procedural textures (created from adjusting parameters of an underlying algorithm that produces an output texture), and bitmap textures (created in an image editing application) are, generally speaking, common methods of implementing texture definition from a 3D animation program, while intended placement of textures onto a model's surface often requires a technique known as UV mapping.
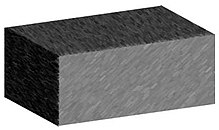
[edit] Volume rendering

Volume rendering is a technique used to display a 2D projection of a 3D discretely sampled data set. A typical 3D data set is a group of 2D slice images acquired by a CT or MRI scanner.
Usually these are acquired in a regular pattern (e.g., one slice every millimeter) and usually have a regular number of image pixels in a regular pattern. This is an example of a regular volumetric grid, with each volume element, or voxel represented by a single value that is obtained by sampling the immediate area surrounding the voxel.
[edit] 3D modeling
3D modeling is the process of developing a mathematical, wireframe representation of any three-dimensional object, called a "3D model", via specialized software. Models may be created automatically or manually; the manual modeling process of preparing geometric data for 3D computer graphics is similar to plastic arts such as sculpting. 3D models may be created using multiple approaches: use of NURBS curves to generate accurate and smooth surface patches, polygonal mesh modeling (manipulation of faceted geometry), or polygonal mesh subdivision (advanced tessellation of polygons, resulting in smooth surfaces similar to NURBS models). A 3D model can be displayed as a two-dimensional image through a process called 3D rendering, used in a computer simulation of physical phenomena, or animated directly for other purposes. The model can also be physically created using 3D Printing devices.
[edit] Pioneers in graphic design
- Charles Csuri
- Charles Csuri is a pioneer in computer animation and digital fine art and created the first computer art in 1964. Csuri was recognized by Smithsonian as the father of digital art and computer animation, and as a pioneer of computer animation by the Museum of Modern Art (MoMA) and (ACM-SIGGRAPH).
- Donald P. Greenberg
- Donald P. Greenberg is a leading innovator in computer graphics. Greenberg has authored hundreds of articles and served as a teacher and mentor to many prominent computer graphic artists, animators, and researchers such as Robert L. Cook, Marc Levoy, and Wayne Lytle. Many of his former students have won Academy Awards for technical achievements and several have won the SIGGRAPH Achievement Award. Greenberg was the founding director of the NSF Center for Computer Graphics and Scientific Visualization.
- A. Michael Noll
- Noll was one of the first researchers to use a digital computer to create artistic patterns and to formalize the use of random processes in the creation of visual arts. He began creating digital computer art in 1962, making him one of the earliest digital computer artists. In 1965, Noll along with Frieder Nake and Georg Nees were the first to publicly exhibit their computer art. During April 1965, the Howard Wise Gallery exhibited Noll's computer art along with random-dot patterns by Bela Julesz.
- Other pioneers
- Arambilet
- Benoît B. Mandelbrot
- Henri Gouraud
- Bui Tuong Phong
- Pierre Bézier
- Paul de Casteljau
- Daniel J. Sandin
- Alvy Ray Smith
- Ton Roosendaal
- Ivan Sutherland
- Steve Russell
[edit] The study of computer graphics
The study of computer graphics is a sub-field of computer science which studies methods for digitally synthesizing and manipulating visual content. Although the term often refers to three-dimensional computer graphics, it also encompasses two-dimensional graphics and image processing.
As an academic discipline, computer graphics studies the manipulation of visual and geometric information using computational techniques. It focuses on the mathematical and computational foundations of image generation and processing rather than purely aesthetic issues. Computer graphics is often differentiated from the field of visualization, although the two fields have many similarities.
[edit] Applications
- Computational biology
- Computational physics
- Computer-aided design
- Computer simulation
- Digital art
- Education
- Graphic design
- Infographics
- Information visualization
- Rational drug design
- Scientific visualization
- Video Games
- Virtual reality
- Web design
[edit] References
- ^ What is Computer Graphics?, Cornell University Program of Computer Graphics. Last updated 04/15/98. Accessed Nov 17, 2009.
- ^ University of Leeds ISS (2002). "What are computer graphics?". Last updated: 22 Sep 2008
- ^ Michael Friendly (2008). "Milestones in the history of thematic cartography, statistical graphics, and data visualization".
- ^ Ira Greenberg (2007). Processing: Creative Coding and Computational Art. Apress. ISBN 159059617X. http://books.google.com/books?id=WTl_7H5HUZAC&pg=PA115&dq=raster+vector+graphics+photographic&lr=&as_brr=0&ei=llOVR5LKCJL0iwGZ8-ywBw&sig=YEjfPOYSUDIf1CUbL5S5Jbzs7M8.
- ^ Rudolf F. Graf (1999). Modern Dictionary of Electronics. Oxford: Newnes. p. 569. ISBN 0-7506-43315. http://books.google.com/books?id=o2I1JWPpdusC&pg=PA569&dq=pixel+intitle:%22Modern+Dictionary+of+Electronics%22+inauthor:graf&lr=&as_brr=0&ei=5ygASM3qHoSgiwH45-GIDA&sig=7tg-LuGdu6Njypaawi2bbkeq8pw.
- ^ Blythe, David. Advanced Graphics Programming Techniques Using OpenGL. Siggraph 1999. (see: Multitexture)
"History of Computer Graphics: 1960." Passagen - Hemsidor. Web. 01 Mar. 2010. <http://hem.passagen.se/des/hocg/hocg_1960.htm>.
[edit] Further reading
- James D. Foley, Andries Van Dam, Steven K. Feiner and John F. Hughes (1995). Computer Graphics: Principles and Practice. Addison-Wesley
- Donald Hearn and M. Pauline Baker (1994). Computer Graphics. Prentice-Hall.
- Francis S. Hill (2001). Computer Graphics. Prentice Hall.
- John Lewell (1985). Computer Graphics: A Survey of Current Techniques and Applications. Van Nostrand Reinhold.
- Jeffrey J. McConnell (2006). Computer Graphics: Theory Into Practice. Jones & Bartlett Publishers.
- R. D. Parslow, R. W. Prowse, Richard Elliot Green (1969). Computer Graphics: Techniques and Applications.
- Peter Shirley and others. (2005). Fundamentals of computer graphics. A.K. Peters, Ltd.
- M. Slater, A. Steed, Y. Chrysantho (2002). Computer graphics and virtual environments: from realism to real-time. Addison-Wesley

No comments:
Post a Comment